Flavor Transformations
This notebook produces the figures in the SNEWPY paper showing the effect of the flavor transformation prescriptions upon the nakazato-shen-z0.004-t_rev100ms-s20.0 model
[1]:
import matplotlib as mpl
import matplotlib.pyplot as plt
import numpy as np

from snewpy.neutrino import MassHierarchy, MixingParameters, ThreeFlavorMixingParameters, FourFlavorMixingParameters
import snewpy.flavor_transformation as xforms
from snewpy.flavor import ThreeFlavor, FourFlavor

from snewpy.models.ccsn import Nakazato_2013

from astropy import units as u
from astropy import constants as c
from astropy.coordinates import SkyCoord, EarthLocation, AltAz
from astropy.time import Time

mpl.rc('font', size=18)
%matplotlib inline
[2]:
model = Nakazato_2013(progenitor_mass=20*u.solMass, revival_time=100*u.ms, metallicity=0.004, eos='shen')
model
[2]:
Nakazato_2013 Model: nakazato-shen-z0.004-t_rev100ms-s20.0.fits
Parameter |
Value |
|---|---|
Progenitor mass |
\(20\) \(\mathrm{M_{\odot}}\) |
Revival time |
\(100\) \(\mathrm{ms}\) |
Metallicity |
0.004 |
EOS |
shen |
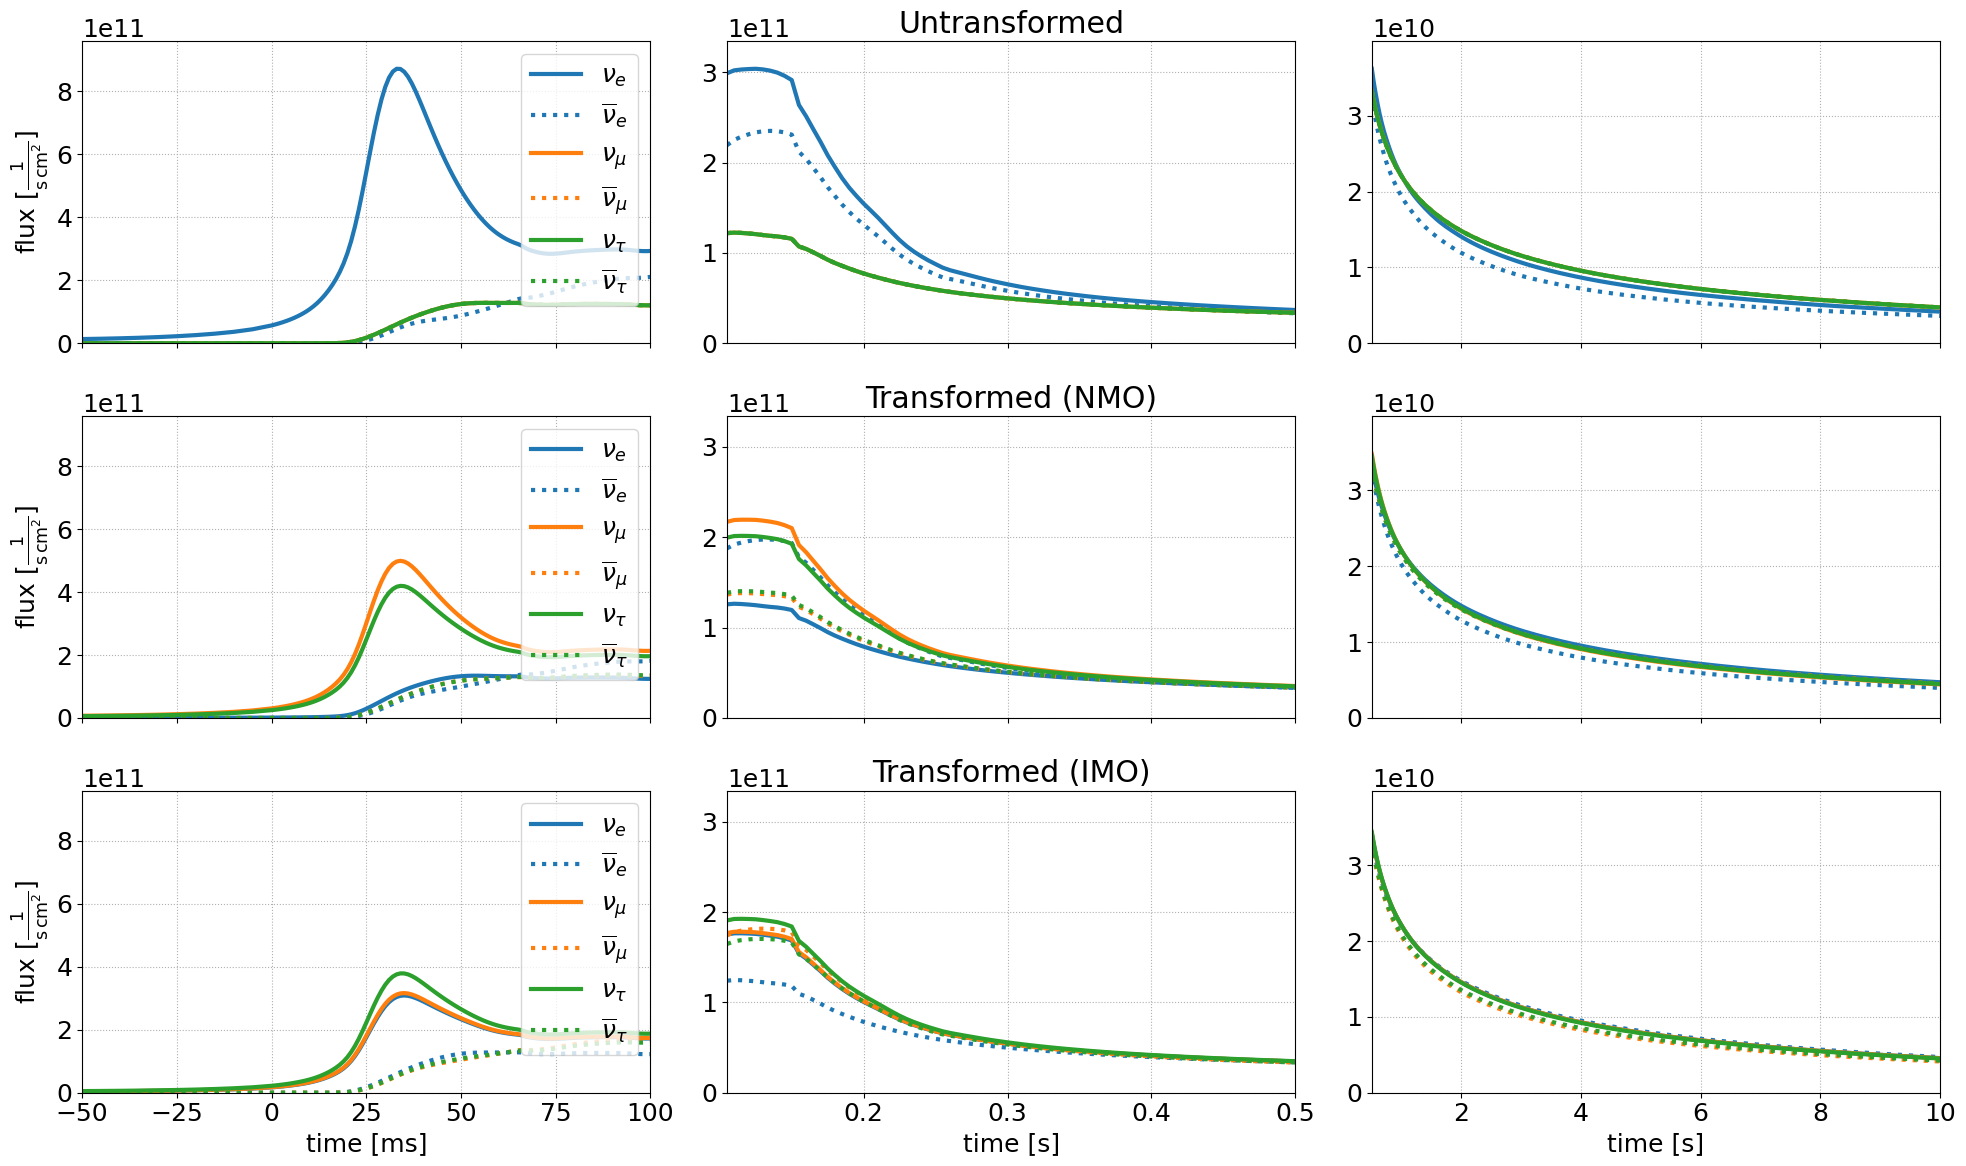
Transformed and untransformed energy integrated flux at Earth
Compute and plot the flux at Earth for a SN at 10 kpc with no flavor transformation, and with the chosen flavor transformation.
[3]:
def plot_total_flux(model, xform_nmo, xform_imo):
    """Plot initial and oscillated neutrino luminosities.

    Parameters
    ----------
    model : SupernovaModel
        An input model from a CCSN simulation.
    flav_xform : FlavorTransformation
        A FlavorTransformation subclass; used to create an instance.
    """

    energies = np.linspace(1,60,119) * u.MeV
    d = 10*u.kpc # distance to SN

    times = model.get_time()
    burst_epoch = times <= 0.1*u.s
    accretion_epoch = (times > 0.1*u.s) & (times <= 0.5*u.s)
    cooling_epoch = (times > 0.5*u.s) & (times <= 10*u.s)

    ispec = model.get_flux(times, energies, d)
    ospec_nmo = model.get_flux(times, energies, d, xform_nmo)
    ospec_imo = model.get_flux(times, energies, d, xform_imo)

    ilum = ispec.integrate_or_sum('energy')
    olum_nmo = ospec_nmo.integrate_or_sum('energy')
    olum_imo = ospec_imo.integrate_or_sum('energy')

    # make the figures
    fig, axes = plt.subplots(3,3, figsize=(20,12), tight_layout=True)

    smax = [0.,0.,0.]
    titles = ['Untransformed', 'Transformed (NMO)', 'Transformed (IMO)']
    for i, spec in enumerate([ilum, olum_nmo, olum_imo]):
        for j, phase in enumerate([burst_epoch, accretion_epoch, cooling_epoch]):
            ax = axes[i,j]
            timeunits = 'ms' if j==0 else 's'
            x_values = times[phase].to(timeunits)
            for flavor in ThreeFlavor:
                y_values = spec.array.squeeze()[flavor][phase].to('1/(cm2 s)')
                if i == 0:
                    smax[j] = np.maximum(smax[j], 1.1*np.max(y_values))

                ax.plot(x_values, y_values, label=flavor.to_tex(), lw=3,
                        color={'E':'C0','MU':'C1','TAU':'C2'}[flavor.lepton],
                        ls='-' if flavor.is_neutrino else ':')

            ax.set(xlim=(x_values[0].value, x_values[-1].value),
                   ylim=(0, smax[j].value))

            if j==0:
                ax.set(ylabel=f'flux [{y_values.unit._repr_latex_()}]')
                ax.legend(loc='upper right', ncol=1, fontsize=18)
            if j==1:
                ax.set(title=titles[i])
            if i < 2:
                ax.set(xticklabels=[])
            else:
                ax.set(xlabel='time [{}]'.format(timeunits))

            ax.grid(ls=':')


    return fig
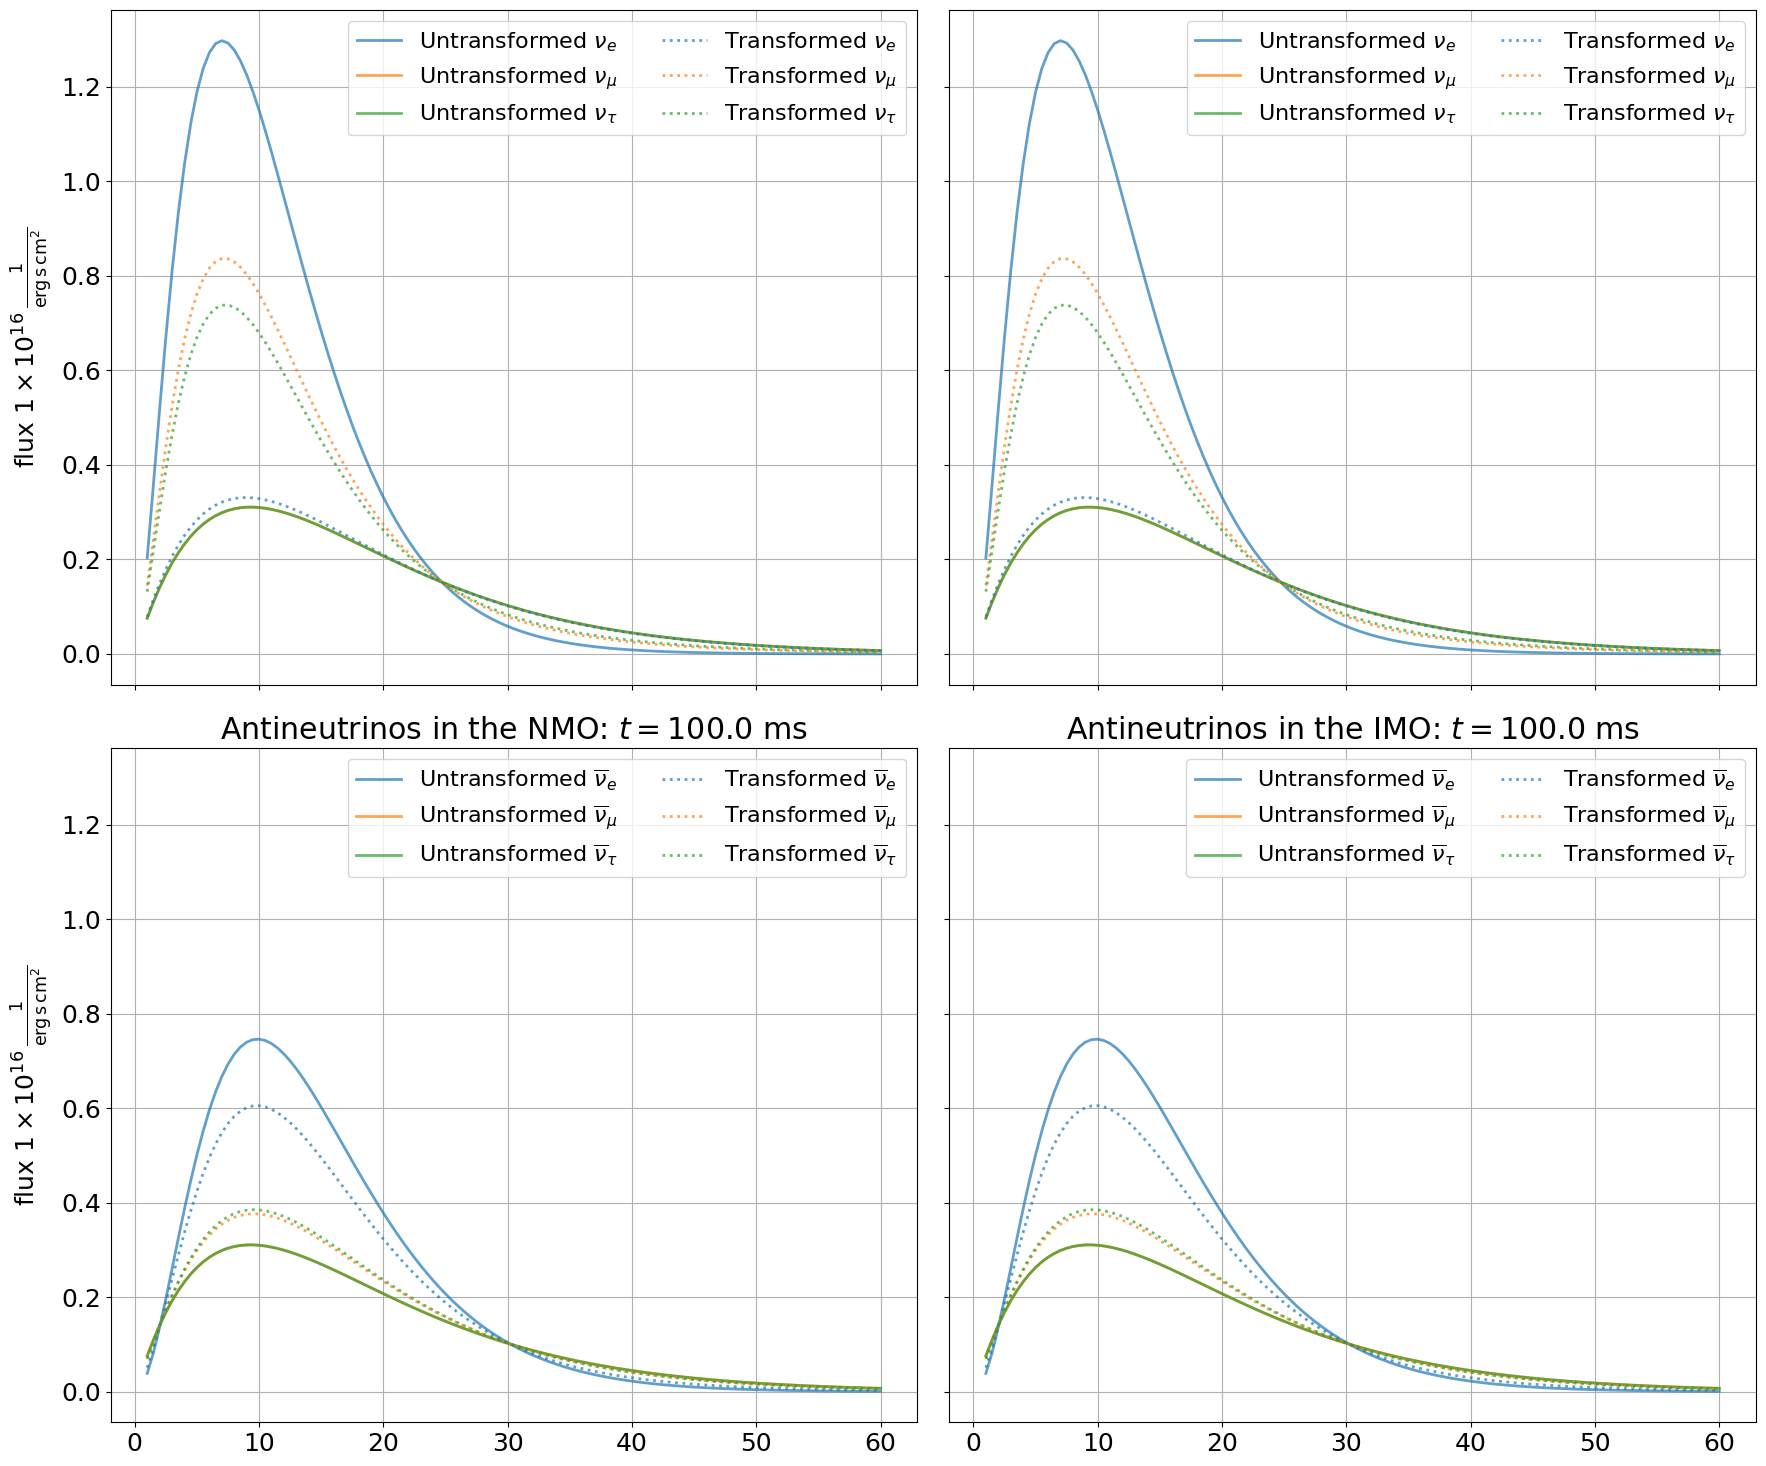
Untransformed and Transformed Spectra at Earth
Compute and plot the spectra at Earth for a SN at 10 kpc with no flavor transformation, and with the chosen flavor transformation.
[4]:
def plot_spectra(model, xform_nmo, xform_imo, t):
    """Plot initial and oscillated neutrino luminosities.

    Parameters
    ----------
    model : SupernovaModel
        An input model from a CCSN simulation.
    flav_xform : FlavorTransformation
        A FlavorTransformation subclass; used to create an instance.
    t : astropy.Quantity
        Time to compute the spectrum.
    """

    energies = np.linspace(1,60,119) * u.MeV
    d = 10*u.kpc # distance to SN

    #get the spectra
    ispec = model.get_flux(t, energies, d)
    ospec_nmo = model.get_flux(t, energies, d, xform_nmo)
    ospec_imo = model.get_flux(t, energies, d, xform_imo)

    fig, axes = plt.subplots(2,2, figsize=(18,15), sharex=True, sharey=True, tight_layout=True)

    for idx_mixing, ospec in enumerate([ospec_nmo, ospec_imo]):
        for idx_nu, flavors in enumerate([ThreeFlavor['NU'], ThreeFlavor['NU_BAR']]):
            for idx_spec, spec in enumerate([ispec, ospec_nmo]):
                spec_val = spec.array.squeeze()
                spec_val = spec_val.to('1e16/(erg s cm2)')
                for flavor in flavors:
                    ax = axes[idx_nu][idx_mixing]
                    ax.plot(energies, spec_val[flavor],
                            label = ('Untransformed','Transformed')[idx_spec]+' '+flavor.to_tex(),
                            color={'E':'C0','MU':'C1','TAU':'C2'}[flavor.lepton],
                            ls=('-',':')[idx_spec],
                            lw=2,  alpha=0.7
                           )

        ax.set(title='{Nu}eutrinos in the {mixing}: $t = ${t:.1f}'.format(Nu=['N','Antin'][idx_nu],
                                                                          mixing=['NMO','IMO'][idx_mixing],
                                                                          t=t)
              )
    for ax in axes.flatten():
        ax.grid()
        ax.legend(loc='upper right', ncol=2, fontsize=16)
    for ax in axes[:,0]:
        ax.set(ylabel=f'flux {spec_val.unit._repr_latex_()}')#[$10^{16}$ erg$^{-1}$ cm$^{-2}$ s$^{-1}$]')

    return fig
[5]:
mixpars_nmo = MixingParameters('NORMAL')
mixpars_imo = MixingParameters('INVERTED')

xform_nmo = xforms.AdiabaticMSW(mixpars_nmo)
xform_imo = xforms.AdiabaticMSW(mixpars_imo)

fig = plot_total_flux(model, xform_nmo, xform_imo)
fig.show()
# fig.savefig('flux_adiabaticmsw.pdf')
fig = plot_spectra(model, xform_nmo, xform_imo, 100*u.ms)
fig.show()
# fig.savefig('spectra_adiabaticmsw.pdf')
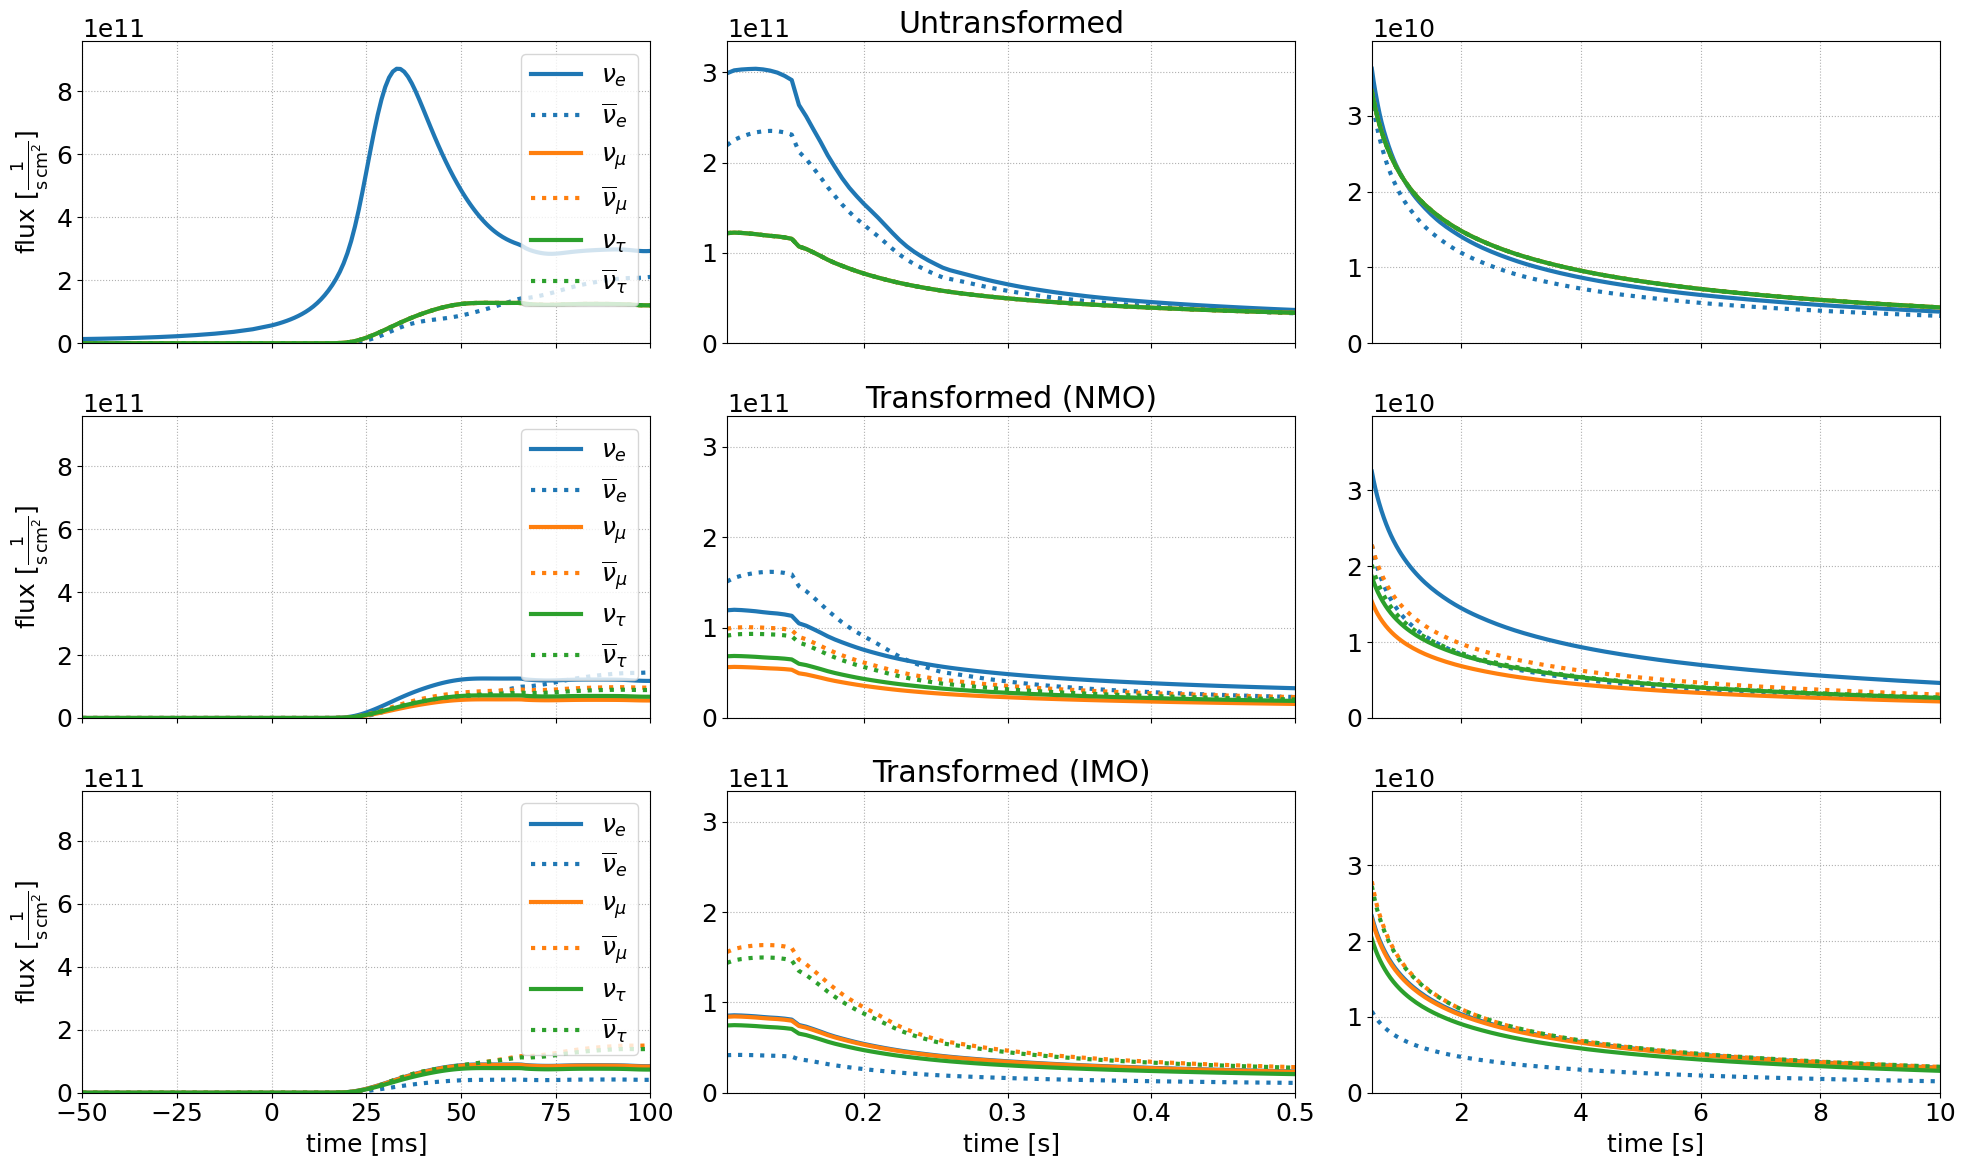
[6]:
# set 1 degree as the mixing angle theta14
mixpars_nmo = FourFlavorMixingParameters(**MixingParameters('NORMAL'), theta14=1*u.deg)
xf_nmo = xforms.AdiabaticMSWes(mixpars_nmo)
mixpars_imo = FourFlavorMixingParameters(**MixingParameters('INVERTED'), theta14=1*u.deg)
xf_imo = xforms.AdiabaticMSWes(mixpars_imo)
fig = plot_total_flux(model, xf_nmo, xf_imo)
fig.show()
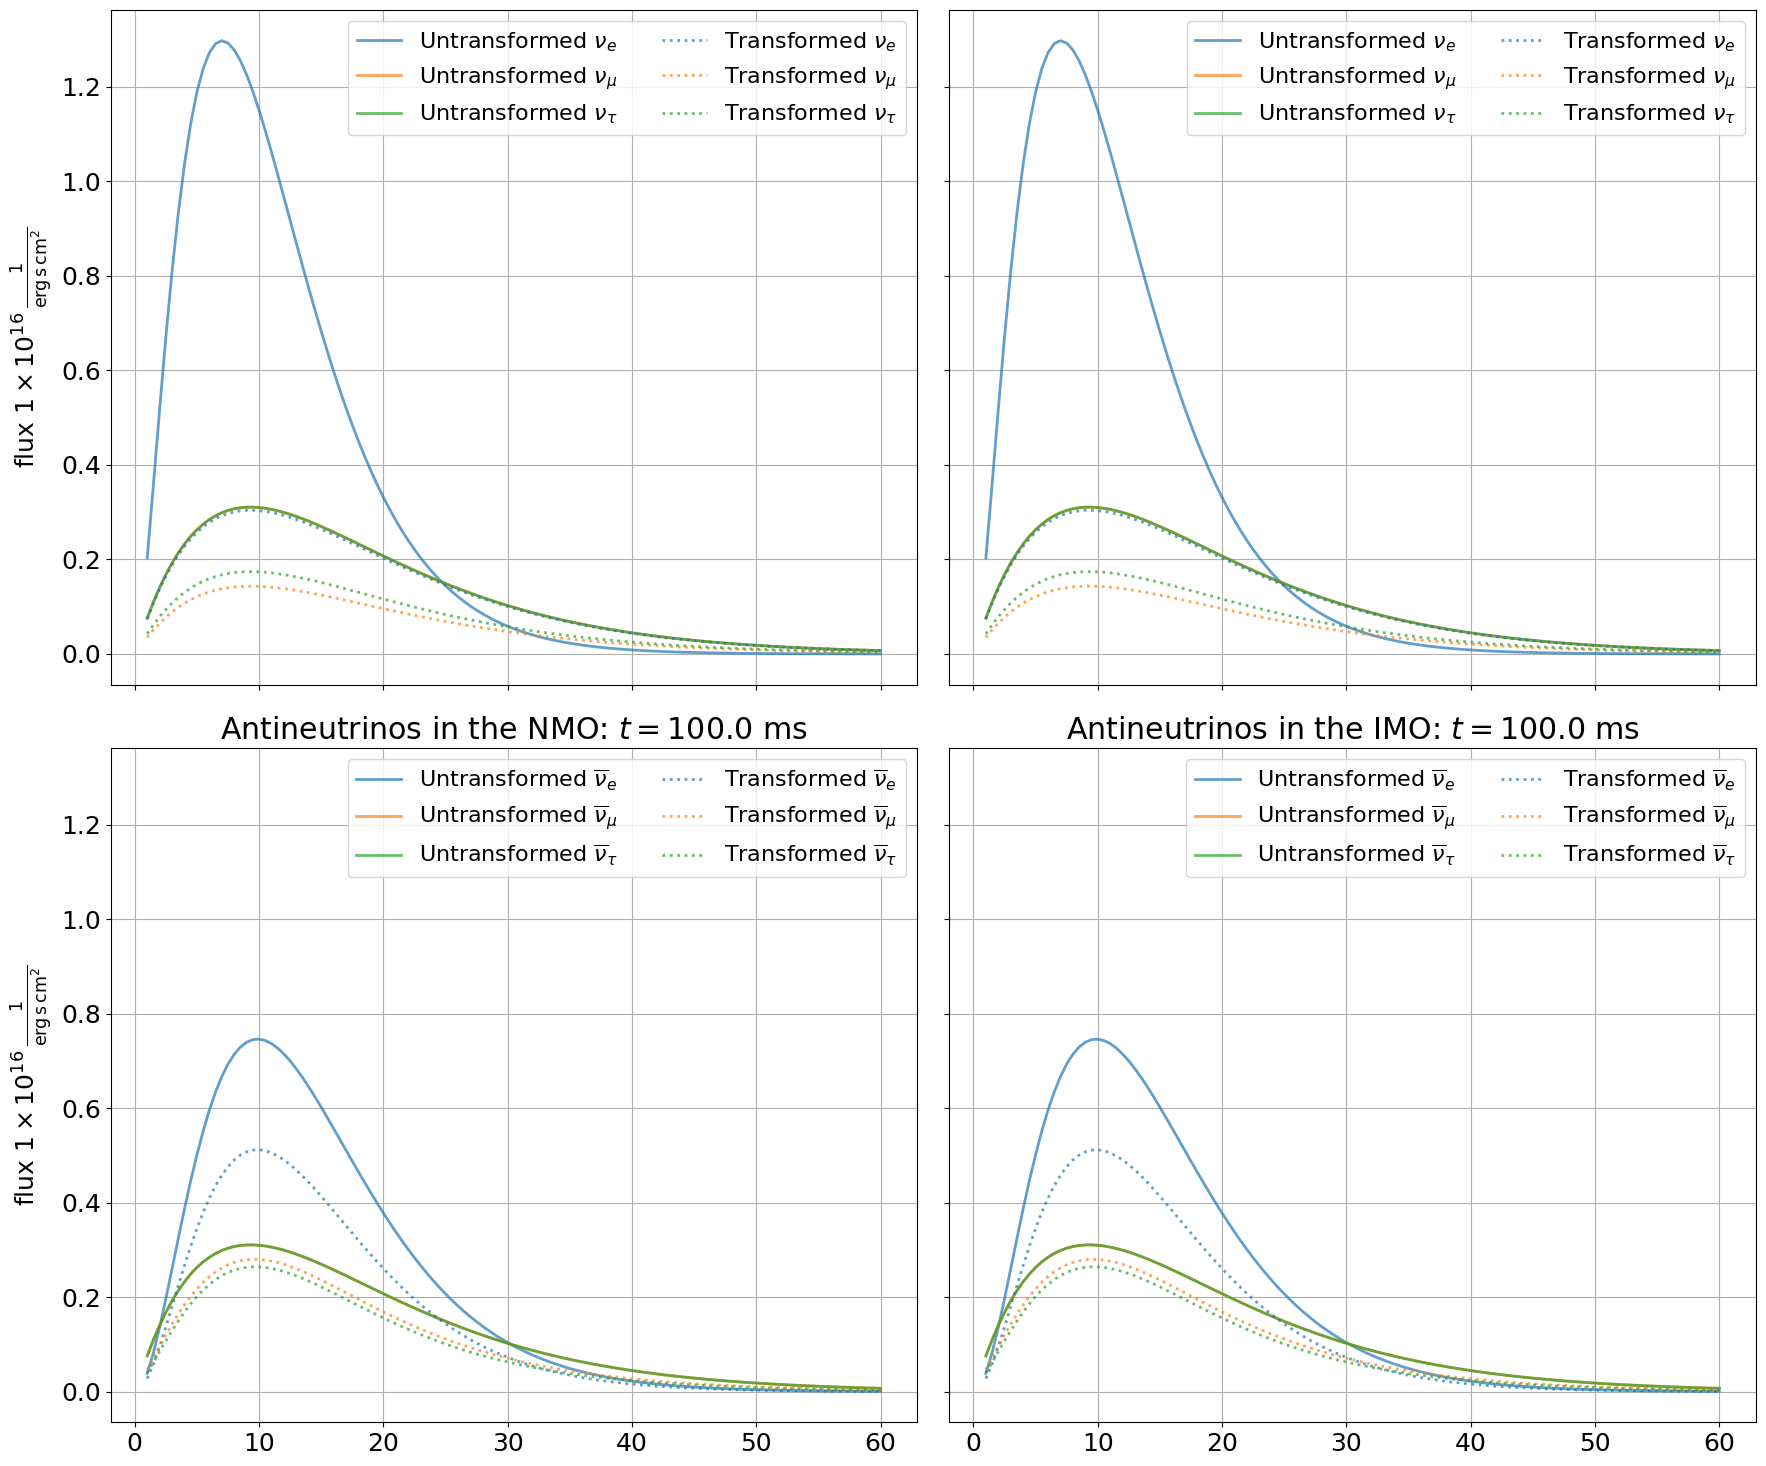
# fig.savefig('flux_adiabaticmswes.pdf')
fig = plot_spectra(model, xf_nmo, xf_imo, 100*u.ms)
fig.show()
# fig.savefig('spectra_adiabaticmswes.pdf')
[ ]: