Creating a Supernova Model with an Analytic Spectrum
This notebook demonstrates how to use the Analytic3Species class from snewpy.models to create an analytic supernova model. The neutrino spectrum of this model follows a Gamma distribution (see arXiv:1211.3920) with user-selected parameters.
In this notebook, we first create a model file, then visualize the spectral parameters and finally use SNOwGLoBES to determine the number of events expected in a detector.
[1]:
import os

from astropy.table import Table
import matplotlib.pyplot as plt
import matplotlib as mpl
import numpy as np

from snewpy import snowglobes, model_path
from snewpy.flavor import ThreeFlavor
from snewpy.models.ccsn import Analytic3Species

mpl.rc('font', size=14)

SNOwGLoBES_path = None  # change to SNOwGLoBES directory if using a custom detector configuration

model_folder = f"{model_path}/AnalyticFluence/"
os.makedirs(model_folder, exist_ok=True)
print(f"Using folder `{model_folder}`.")
Using folder `/Users/shlok2223/.astropy/cache/snewpy/models/AnalyticFluence/`.
Creating a SN model file modelled after the Livermore model
[2]:
# These numbers _almost_ reproduce the Livermore model included in the SNOwGLoBES repository.
# They are obtained by calculating the total L, <E> and <E^2> from the livermore.dat
# fluence file (which is modelled after a 10kpc supernova).
total_energy = (5.478e+52, 5.485e+52, 4 * 5.55e+52)
mean_energy = (11.5081, 15.4678, 21.0690)
rms_or_pinch = "rms"
rms_energy = (12.8788, 17.8360, 24.3913)

# Make an astropy table with two times, 0s and 1s, with constant neutrino properties
table = Table()
table['TIME'] = np.linspace(0,1,2)
table['L_NU_E'] =  np.linspace(1,1,2)*total_energy[0]
table['L_NU_E_BAR'] = np.linspace(1,1,2)*total_energy[1]
table['L_NU_X'] = np.linspace(1,1,2)*total_energy[2]/4. #Note, L_NU_X is set to 1/4 of the total NU_X energy

table['E_NU_E'] = np.linspace(1,1,2)*mean_energy[0]
table['E_NU_E_BAR'] = np.linspace(1,1,2)*mean_energy[1]
table['E_NU_X'] = np.linspace(1,1,2)*mean_energy[2]

if rms_or_pinch == "rms":
    table['RMS_NU_E'] = np.linspace(1,1,2)*rms_energy[0]
    table['RMS_NU_E_BAR'] = np.linspace(1,1,2)*rms_energy[1]
    table['RMS_NU_X'] = np.linspace(1,1,2)*rms_energy[2]
    table['ALPHA_NU_E'] = (2.0 * table['E_NU_E'] ** 2 - table['RMS_NU_E'] ** 2) / (
        table['RMS_NU_E'] ** 2 - table['E_NU_E'] ** 2)
    table['ALPHA_NU_E_BAR'] = (2.0 * table['E_NU_E_BAR'] ** 2 - table['RMS_NU_E_BAR'] ** 2) / (
        table['RMS_NU_E_BAR'] ** 2 - table['E_NU_E_BAR'] ** 2)
    table['ALPHA_NU_X'] = (2.0 * table['E_NU_X'] ** 2 - table['RMS_NU_X'] ** 2) / (
        table['RMS_NU_X'] ** 2 - table['E_NU_X'] ** 2)
elif rms_or_pinch == "pinch":
    table['ALPHA_NU_E'] = np.linspace(1,1,2)*pinch_values[0]
    table['ALPHA_NU_E_BAR'] = np.linspace(1,1,2)*pinch_values[1]
    table['ALPHA_NU_X'] = np.linspace(1,1,2)*pinch_values[2]
    table['RMS_NU_E'] = np.sqrt((2.0 + table['ALPHA_NU_E'])/(1.0 + table['ALPHA_NU_E'])*table['E_NU_E']**2)
    table['RMS_NU_E_BAR'] =  np.sqrt((2.0 + table['ALPHA_NU_E_BAR'])/(1.0 + table['ALPHA_NU_E_BAR'])*table['E_NU_E_BAR']**2)
    table['RMS_NU_X'] = np.sqrt((2.0 + table['ALPHA_NU_X'])/(1.0 + table['ALPHA_NU_X'])*table['E_NU_X']**2 )
else:
    print("incorrect second moment method: rms or pinch")

filename = "AnalyticFluence_demo.dat"
table.write(model_folder + filename, format='ascii', overwrite=True)
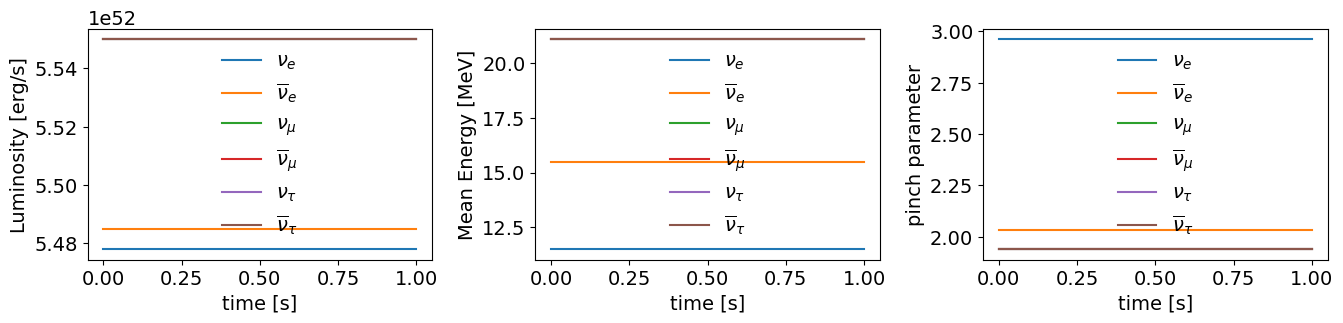
Visualizing the Analytic Model
[3]:
%matplotlib inline
filename = "AnalyticFluence_demo.dat"
model = Analytic3Species(model_folder + filename)

fig,axes = plt.subplots(1,3,figsize=(16,3))
plt.subplots_adjust(wspace=0.3)
for flavor in ThreeFlavor:
    axes[0].plot(model.time,model.luminosity[flavor],label=flavor.to_tex())
    axes[1].plot(model.time,model.meanE[flavor],label=flavor.to_tex())
    axes[2].plot(model.time,model.pinch[flavor],label=flavor.to_tex())

axes[0].set_ylabel("Luminosity [erg/s]")
axes[0].set_xlabel("time [s]")
axes[0].legend(frameon=False)

axes[1].set_ylabel("Mean Energy [MeV]")
axes[1].set_xlabel("time [s]")
axes[1].legend(frameon=False)

axes[2].set_ylabel("pinch parameter")
axes[2].set_xlabel("time [s]")
axes[2].legend(frameon=False)
[3]:
<matplotlib.legend.Legend at 0x30b0147a0>
Calculating Number of Events
May 2026: The following two cells are BROKEN To be fixed in a new PR.
[4]:
#set model type as
modeltype = 'Analytic3Species'
#set model file we just created above
filename = "AnalyticFluence_demo.dat"

#set desired Oscillation scenario, snowglobes default is
#NoTransformation, so that is used here to match the output of
#./supernova.pl livermore water wc100kt30prct
transformation = "NoTransformation"

#set distance in kpc
distance=10

#set desired detector
detector='wc100kt30prct'

#Running the SNEWPY/SNOwGLoBES modules
outfile = "Analytic3Species_demo"

#first generated integrated fluence files for SNOwGLoBES
print("Preparing fluences ...")
tarredoutfile = snowglobes.generate_fluence(model_folder + filename, modeltype, transformation, distance, outfile)

# #run the fluence file through SNOwGLoBES
# print("Running SNOwGLoBES ...")
# snowglobes.simulate(SNOwGLoBES_path, tarredoutfile, detector_input=detector)

# print("Collating...")
# tables = snowglobes.collate(SNOwGLoBES_path, tarredoutfile, skip_plots=True)

# totalcounts = 0
# for i in range(1,6):
#     print("Number of events of type",tables['Collated_'+outfile+'_'+detector+'_events_smeared_weighted.dat']['header'].split()[i],end=': ')
#     counts = sum(tables['Collated_'+outfile+'_'+detector+'_events_smeared_weighted.dat']['data'][i])
#     totalcounts += counts
#     print(counts)
# print("Total number of events: ",totalcounts)
Preparing fluences ...
---------------------------------------------------------------------------
AttributeError                            Traceback (most recent call last)
Cell In[4], line 22
     20 #first generated integrated fluence files for SNOwGLoBES
     21 print("Preparing fluences ...")
---> 22 tarredoutfile = snowglobes.generate_fluence(model_folder + filename, modeltype, transformation, distance, outfile)
     24 #run the fluence file through SNOwGLoBES
     25 print("Running SNOwGLoBES ...")

File /opt/anaconda3/envs/snewpyDevelopments/lib/python3.12/site-packages/snewpy/snowglobes.py:132, in generate_fluence(model_path, model_type, transformation_type, d, output_filename, tstart, tend, snmodel_dict)
    102 def generate_fluence(model_path, model_type, transformation_type, d, output_filename=None, tstart=None, tend=None, snmodel_dict={}):
    103     """Generate fluence files in SNOwGLoBES format.
    104
    105     This version will subsample the times in a supernova model, produce energy
   (...)    130         Path of NumPy archive file with neutrino fluence data.
    131     """
--> 132     model_class = getattr(snewpy.models.ccsn_loaders, model_type)
    134     # Choose flavor transformation. Use dict to associate the transformation name with its class.
    135     NMO = MixingParameters('NORMAL')

AttributeError: module 'snewpy.models.ccsn_loaders' has no attribute 'Analytic3Species'
[ ]:
# for smear in ["smeared", "unsmeared"]:
#     energy = tables['Collated_'+outfile+'_'+detector+'_events_'+smear+'_weighted.dat']['data'][0]*1000.
#     nc = tables['Collated_'+outfile+'_'+detector+'_events_'+smear+'_weighted.dat']['data'][1]
#     escattering = tables['Collated_'+outfile+'_'+detector+'_events_'+smear+'_weighted.dat']['data'][2]
#     ibd = tables['Collated_'+outfile+'_'+detector+'_events_'+smear+'_weighted.dat']['data'][3]
#     nueO16 = tables['Collated_'+outfile+'_'+detector+'_events_'+smear+'_weighted.dat']['data'][4]
#     nuebarO16 = tables['Collated_'+outfile+'_'+detector+'_events_'+smear+'_weighted.dat']['data'][5]
#     plt.plot(energy,nc,label="NC")
#     plt.plot(energy,escattering,label="escattering")
#     plt.plot(energy,ibd,label="ibd")
#     plt.plot(energy,nueO16,label="nueO16")
#     plt.plot(energy,nuebarO16,label="nuebarO16")
#     plt.legend()
#     plt.title(smear)
#     plt.xlabel("Energy [MeV]")
#     plt.ylabel("Count per bin")
#     plt.yscale('log')
#     plt.show()
[ ]: