Getting Started
Installation
To use SNEWPY, first install it using pip:
$ pip install snewpy
Download Supernova Models
SNEWPY includes a large number of supernova models from different simulation groups. Since these models have a size of several 100 MB, they are not included in the initial install. Instead, SNEWPY automatically loads these files the first time you use a model. Alternatively, you can run the following command to bulk download model files:
$ python -c 'import snewpy; snewpy.get_models()'
Files are downloaded to a hidden directory given by snewpy.model_path.
Note
The documentation for each model includes more information, including a reference to the corresponding publication (e.g. DOI or arXiv identifier). If you use one of these models, please always cite the appropriate reference.
Usage
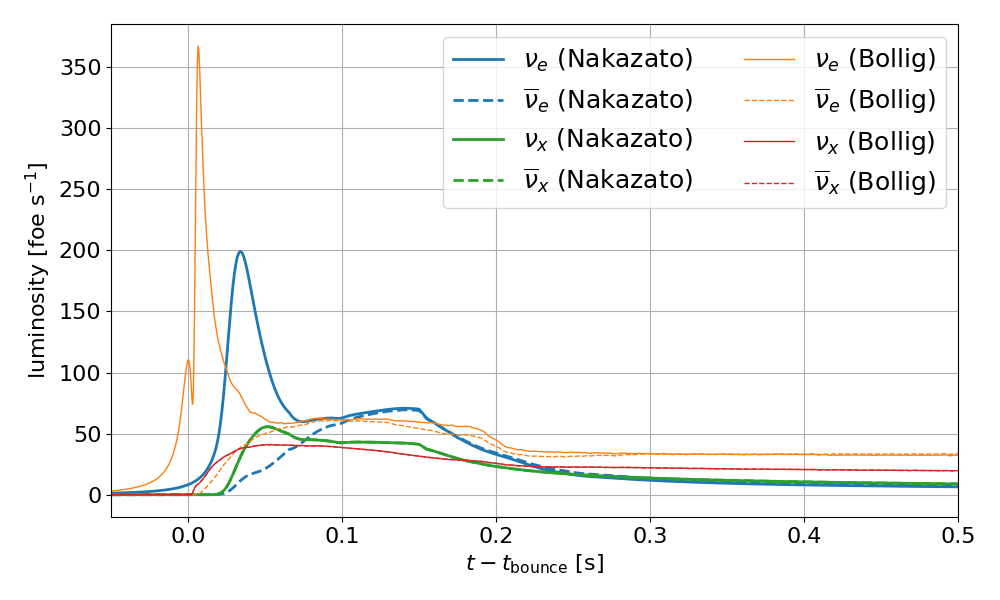
This example script shows how to use SNEWPY to compare the luminosity of two different supernova models:
import astropy.units as u
import matplotlib as mpl
import matplotlib.pyplot as plt

import snewpy
from snewpy.models.ccsn import Nakazato_2013, Bollig_2016
from snewpy.neutrino import Flavor

mpl.rc('font', size=16)
%matplotlib inline

# Initialise two different models. This automatically downloads the required data files.
nakazato = Nakazato_2013(progenitor_mass=20*u.solMass, revival_time=100*u.ms, metallicity=0.004, eos='shen')
bollig = Bollig_2016(progenitor_mass=27*u.solMass)

# Plot luminosity of both models
fig, ax = plt.subplots(1, figsize=(10, 6))

for flavor in Flavor:
    ax.plot(nakazato.time, nakazato.luminosity[flavor]/1e51,  # Report luminosity in units foe/s
            label=flavor.to_tex() + ' (Nakazato)',
            color='C0' if flavor.is_electron else 'C2',
            ls='-' if flavor.is_neutrino else '--',
            lw=2)

for flavor in Flavor:
    ax.plot(bollig.time, bollig.luminosity[flavor]/1e51,  # Report luminosity in units foe/s
            label=flavor.to_tex() + ' (Bollig)',
            color='C1' if flavor.is_electron else 'C3',
            ls='-' if flavor.is_neutrino else '--',
            lw=1)

ax.set(xlim=(-0.05, 0.5), xlabel=r'$t-t_{\rm bounce}$ [s]', ylabel=r'luminosity [foe s$^{-1}$]')
ax.grid()
ax.legend(loc='upper right', ncol=2, fontsize=18)
This will generate the following figure:
The SNEWPY repository contains many Jupyter notebooks in doc/source/nb/ with sample code
showing different models or how to apply flavor transformations to the neutrino fluxes.
More advanced usage of SNEWPY requires SNOwGLoBES and is described in the following section.